|
TECHNICAL
PARAMETERS AFFECTING MACAW BAND-PASS FILTER SELECTION
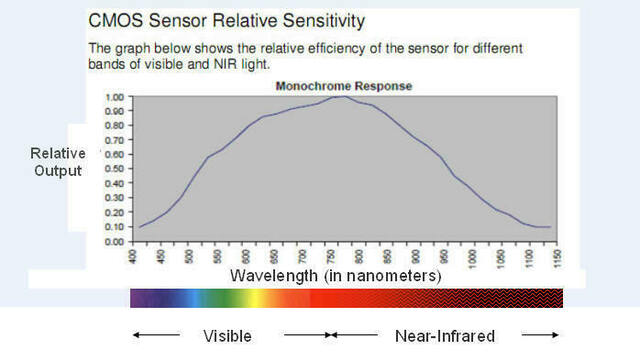
Electric current is
developed in an image sensor in response to the electromagnetic
radiation that contacts it. The amount of current generated
depends upon the brightness and wavelength of the radiation that hits
the sensor. For a given brightness, Macaw output is
greatest in response to wavelengths in the area of 800nm. The output
drops in a smooth curve to an approximate 20% peak output at 450 nm in
the visible spectrum and 1050 nm in the near-infrared at
the limits of its range. A
graph of the sensitivity of the camera's image sensor to impinging
radiation is shown below.
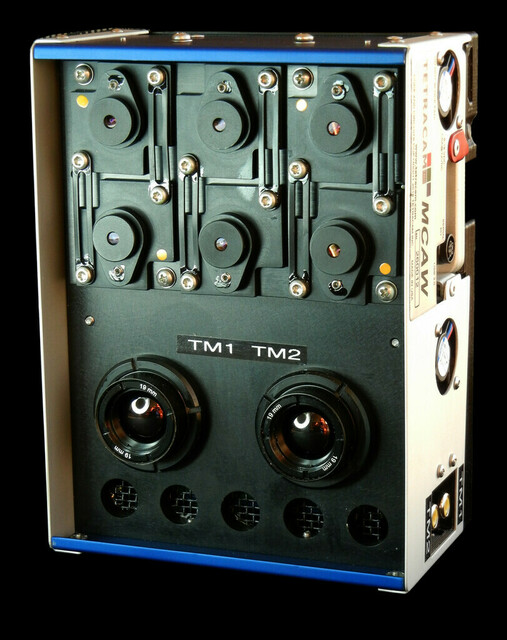
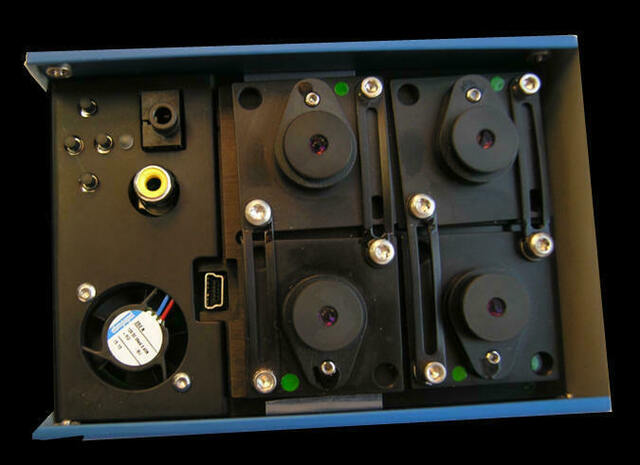
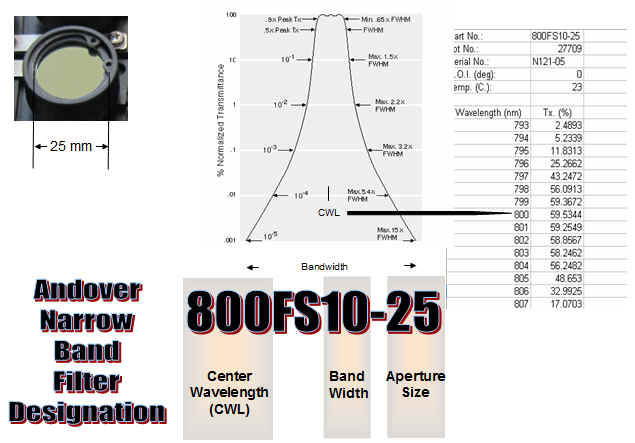
The
spectroscopic filters used in Macaw systems are supplied by
Andover Corporation.
These are placed between each Macaw
camera's lens and sensor. The filters restrict the radiation
that is able to contact the sensor to a narrow band of
wavelengths. Andover filter designations indicate
the filter's center wavelength, band width and the size of the aperture
they fit. All Macaw systems use filters with a 25 mm
diameter.
The amount of light that is allowed to hit the
sensor increases as filter bandwidth increases. As a rule, 10
nm bandwidths provide optimum multi-spectral imagery in Macaw
systems. Wider bandwidths tend to over saturate the
sensor. The exceptions to this occur at the limits of the
sensor's sensitivity range. Here, the greater amount of light
that broader bandwidth filters pass is offset by the sensor's decreased
sensitivity.
ORDERING AND REPLACING
MACAW BAND-PASS FILTERS
Macaw filters are customer-designated at the
time of order. The filters are field-replaceable using
standard 25mm spectrometer filters so these systems may be reconfigured
in the field to sense entirely new spectral combinations.
Field replacement of filters is limited by the following considerations:
Since wavelength impacts focus, Macaws are
initially set up in the factory for optimum focus based on the
wavelengths of the filters initially selected by the user.
Changing filters in the field, changes the camera's focal
point. To insure the Macaw cameras provide optimum
focus, users should only replace a Macaw filter that is near the
wavelength of the filter originally inserted into that
camera.
In the visible spectrum, replacing a filter with a
new one that is within plus or minus 100 nm of the original is
acceptable. Beyond 700 nm, replacement filters should be
within plus or minus 50 nm of the original. Replacement of
filters beyond this range requires factory re-focusing of the unit.
SELECTING
OPTIMUMMACAW BAND-PASS FILTERS
FOR YOUR APPLICATION
Both Andover's standard
and custom filters may be used for Macaw applications.
The filters we select to include in our standard filter sets are chosen
based on their ability to expose conditions able to be derived from
vegetation spectral reflectance curves such as the one shown below.
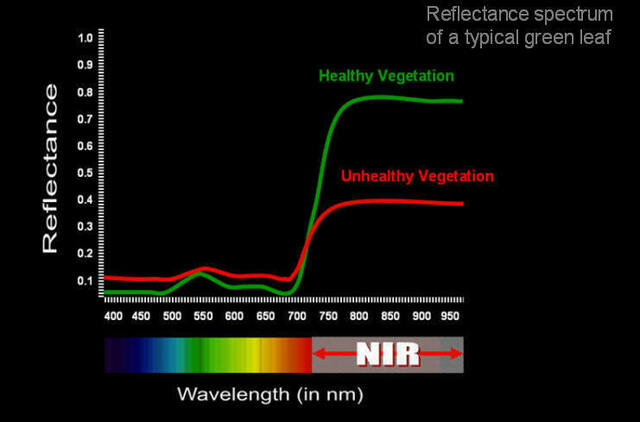
The selection
criteria we use are based on the following factors:
We select filters for our standard filter set from
Andover's list of Standard Filters. This is available on the
Andover Corporation
website.
Customers may pick any filter from Andover's Standard
List to substitute for a filter in our Standard Filter Set with no
change in the product's price. The price of custom filters
are quoted at the time of their order.
Below is a list of filters in the Standard Filter
Set for each Macaw model with a description of each filter's uses
MACAW STANDARD FILTERS AND
THEIR USES
|
Macaw
Model
Number
|
Filter
Designation
|
Reason
for Inclusion in Standard Set (Filter Uses or Significance)
|
| Macaw-4 |
|
|
| - 490FS10-25 |
Blue - Ten nanometer
slice of Landsat 5 TM Band 1, This provides increased
penetration of water bodies and also is capable of differentiating soil
and rock surfaces from vegetation and for detecting cultural features.1
This is the point of crop
to soil reflectance ratio Microma for blue and green bands. The band is
sensitive to loss of chlorophyll, browning, ripening, senescing, and
soil background effects). It is also sensitive to senescing rates and
is generally an excellent predictor of grain yield.2 |
| - 550FS10-25 |
Green - Ten nanometer
slice of Landsat 5 TM Band 2, it is sensitive to water turbidity
differences.1 Positive change in
reflectance per unit change in wavelength of this visible spectrum is
maximum around this band. 2 The so
called "green hump" in vegetation spectral reflectance curves is useful
in predicting chlorophyll content. 3 |
| - 680FS10-25 |
Red - Ten nanometer
slice of Landsat 5 TM Band 3, this may be used in the
derivation of the Normalized Difference Vegetation Index where NDVI=(TM4-TM3)/(TM4+TM3).
Cited for NDVI measurement by ENVI with 800 nm 9
Absorption in the red band (600 to 700 nm) varies significantly due to
changes in factors such as biomass, LAI soil background, cultivar
types, canopy structure, nitrogen, moisture, and stress in plants 2
Note: Users may
substitute a 660 nm filter with designation of 660FS10-25 for the 680
nm designated 680FS10-25. The 660 nm filter is a common
choice among Tetracam customers. This is the chlorophyll
absorption pre-maxima (or reflectance Microma). Absorption in the red
band (600 to 700 nm) varies significantly due to changes in factors
such as biomass, LAI soil background, cultivar types, canopy structure,
nitrogen, moisture, and stress in plants 2 |
| - 800FS10-25 |
NIR - Ten nanometer
slice of Landsat 5 TM Band 4, this may be used in derivation of
Normalized Difference Vegetation Index where NDVI=(TM4-TM3)/(TM4+TM3).
Cited for NDVI measurement by ENVI with 680 nm 9
This may also be used in derivation of an NDVI variant called
Re-normalized Difference Vegetation Index where RDVI=(R800 -
R671))/(R800 + R671)1/2
. RDVI is based on the contrast between the maximum
absorption in the red due to chlorophyll pigments and the maximum
reflection in the infrared caused by leaf cellular structure.
This filter also plays a role in a Modified Soil Adjusted Vegetation
Index (MSAVI) developed to cancel soil reflectance and Soil and
Atmospherically Resistant Vegetation Index (SARVI), which Micromizes
both canopy background and atmospheric effects, 7
This filter is also useful in calculations of various plant pigment
ratios such as Pigment Specific Simple ratio Chl (PSSR), Pigment
Specific Normalized Difference (PSND) and Structure-Insensitive Pigment
Index (SIPI). Ratios between plant pigments often change in
response to specific vegetation stress conditions such as changes in
the carotenoid/chlorophyll ratio in apple trees in response to mite
attacks. 6 |
| |
|
| Macaw-6 |
|
|
| - 490FS10-25 |
- See Macaw-4 |
| - 550FS10-25 |
- See Macaw-4 |
| - 680FS10-25 |
- See Macaw-4 |
| - 720FS10-25 |
- Red Edge - The red
edge describes the steeply sloped region of the vegetation spectral
reflectance curve between 690 nm and 740 nm that is caused by the
transition from chlorophyll absorption of red wavelengths and
near-infrared reflection due to the mesophyll cells in leaves which in
healthy plants act like a mirror to NIR. This band is
sensitive to temporal variations in crop growth and vegetation stress
and provides additional information about chlorophyll and nitrogen
status of plants. 2. |
| - 800FS20-25 |
- See Macaw-4 |
| - 900FS20-25 |
-NIR-
Peak or maximum reflectance region of the NIR spectrum for certain
types and/or growth stages of vegetation or crops. For crops
such as cotton and corn or when crops are under stress or senescing
there is significant change in reflectance along the "NIR
shoulder." Useful for computing crop moisture sensitive
index. 2. |
| |
|
|
Macaw-12
|
|
|
|
- 490FS10-25
|
-
See Macaw-4 |
| - 520FS10-25 |
-Green
- Positive change in reflectance per unit change in wavelength of this
visible spectrum is maximum around this "green" waveband. First order
derivative plot of crop spectra will show this. Green band
peak (or the point maximal reflectance) in the visible spectrum.
2 |
| - 550FS10-25 |
-
See Macaw-4 |
| - 570FS10-25 |
- Green -Negative change
in reflectance per unit change in wavelength of the visible spectrum is
maximum around this wavelength.2 Factor in
photochemical reflectance index (PRI) for estimating photosynthetic
light use efficiency. Also compares the reflectance in the red and blue
regions of the spectrum.3
Used as factor in calculating PRI for xanthophyll cycle pigment change
detection, carotenoid/chlorophyll ratio monitoring and water stress
detection.4 |
| - 671FS10-25 |
-Red
- This may be used in the derivation of an NDVI variant called
Re-normalized Difference Vegetation Index where RDVI=(R800 -
R671) / (R800 + R671)1/2
. RDVI is based on the contrast between the maximum
absorption in the red due to chlorophyll pigments and the maximum
reflection in the infrared caused by leaf cellular structure. This
filter also plays a role in a Modified Soil Adjusted Vegetation Index
(MSAVI) developed to cancel soil reflectance in NDVI calculations and
Soil and Atmospherically Resistant Vegetation Index (SARVI), which
Micromizes both canopy background and atmospheric effects, 7
|
| - 680FS10-25 |
-
See Macaw-4 |
| - 700FS10-25 |
- Red Edge - This is a
second red edge monitoring wavelength. The red edge slope
decreases as NIR reflectance drops in insect-damaged foliage. The
wavelength and point of maximum slope also shift during senescence or
stress-induced chlorosis. 8
So,Red Edge Position (REP) is an excellent indicator of plant stress
and growth. 2. Also a factor in
Chlorophyll Absorption in Reflectance Index (CARI) used in estimating
chlorophyll content in crops. 6 |
| - 720FS10-25 |
-
See Macaw-6 |
| - 800FS10-25 |
- See Macaw-4 |
|
- 840FS10-25
|
NIR
- This filter's maximum transmissivity actually occurs at 845
nm. This operates in the best spectral region to distinguish
vegetation varieties and conditions. This is the
center of the "NIR shoulder." For many crops, a broad-band or
a narrow-band will provide the same result due to near uniform
reflectance throughout the NIR shoulder (740 to 940 nm). In such
instances, other bands along the NIR shoulder will be redundant. |
| - 900FS20-25 |
-
See Macaw-6 |
|
- 950FS40-25
|
-NIR
- Center of the moisture sensitive "trough" portion of NIR. The
"trough" portion varies from 940 to 1040 nm and typically has Micromum
reflectance around 975 nm (or point of maximum "dip" in the trough
portion). Plant moisture sensitive band.2 This
band is used in calculation of the Water Band Index where WBI = P900 /
P970 9 |
| |
|
1 Band Combinations (James Quinn) University of Northern Iowa
2 Evaluation of Narrowband and Broadband
Vegetation Indices for Determining Optimal Hyperspectral Wavebands for
Ag Crop Characterization
3 Relationships between leaf pigment content
and spectral reflectance across a wide range of species, leaf
structures and developmental stages
4 Assessing canopy PRI for water stress
detection with diurnal airborne imagery
5 Vegetation
indices as indicators of damage by the sunn pest (Hemiptera:
Scutelleridae) to field grown wheat
6 Soil
Backgrounds Impact Analysis on Chlorophyll Indices Using Field,
Airborne and Satellite Hyperspectral Data
7 Hyperspectral
vegetation indices and novel algorithms for predicting green LAI of
crop canopies
8 Spectral reflectance characteristics of
eucalypt foliage damaged by insects
8 Reference ENVI Users Guide - Page 1243
|